
A device-level sizing guide: derive capacity from real watts, VA and working states, without repeating branch-network architecture.
Section 01
Set the Measurement Boundary
A device-level sizing guide: derive capacity from real watts, VA and working states, without repeating branch-network architecture.
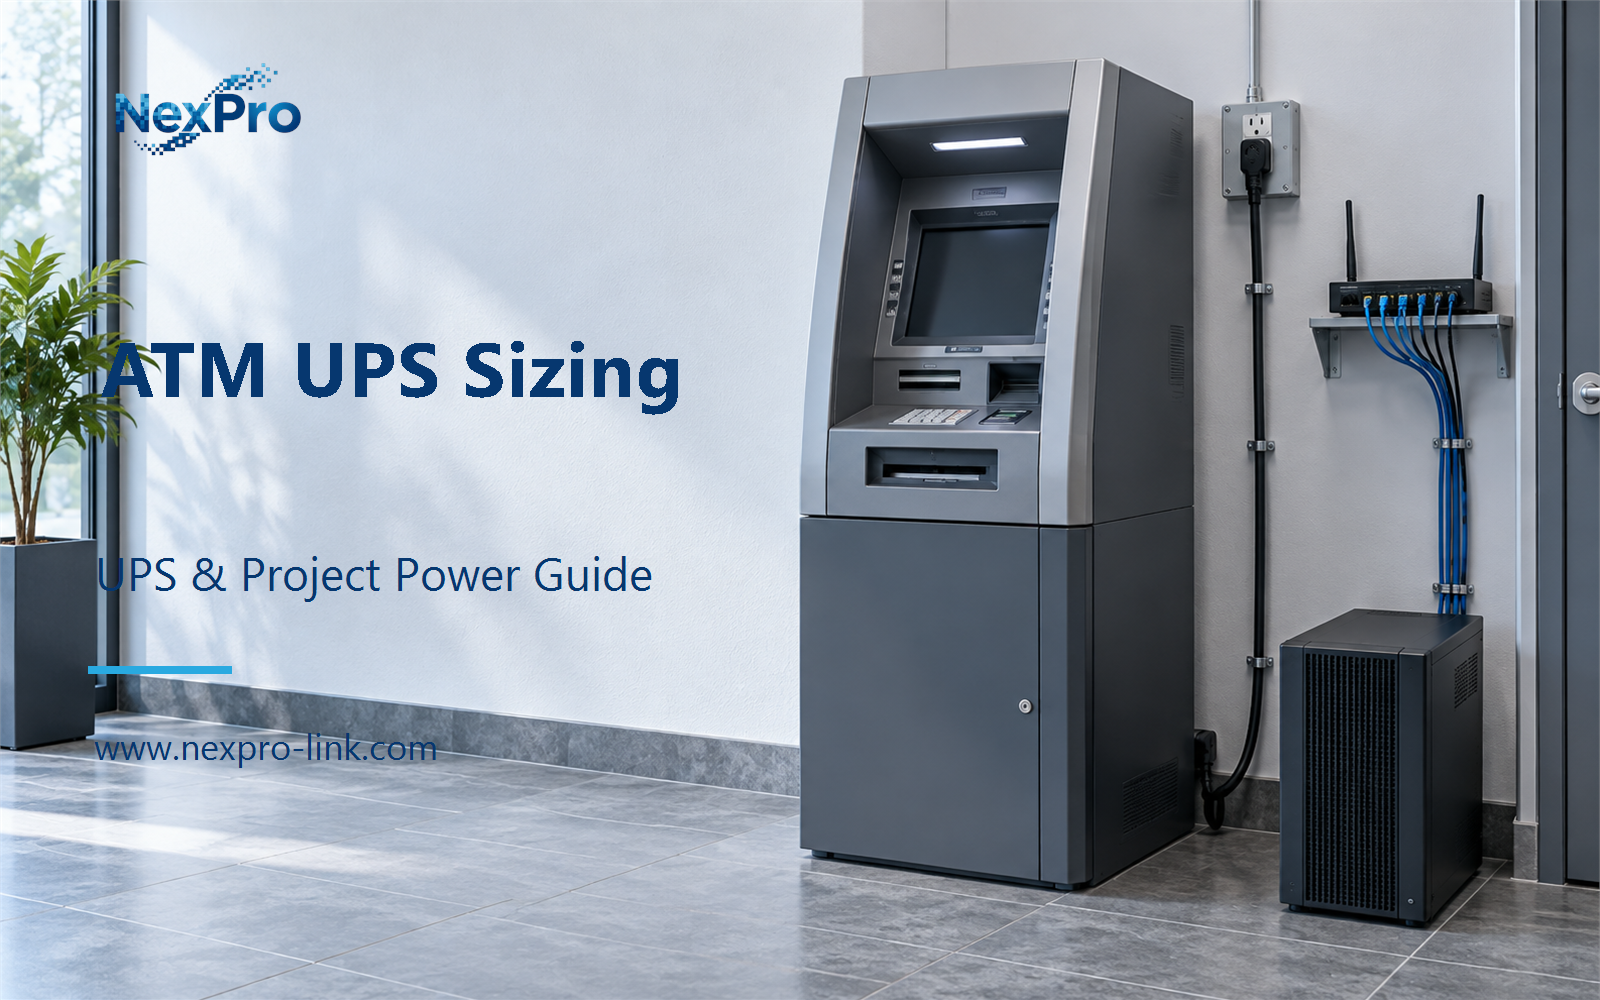
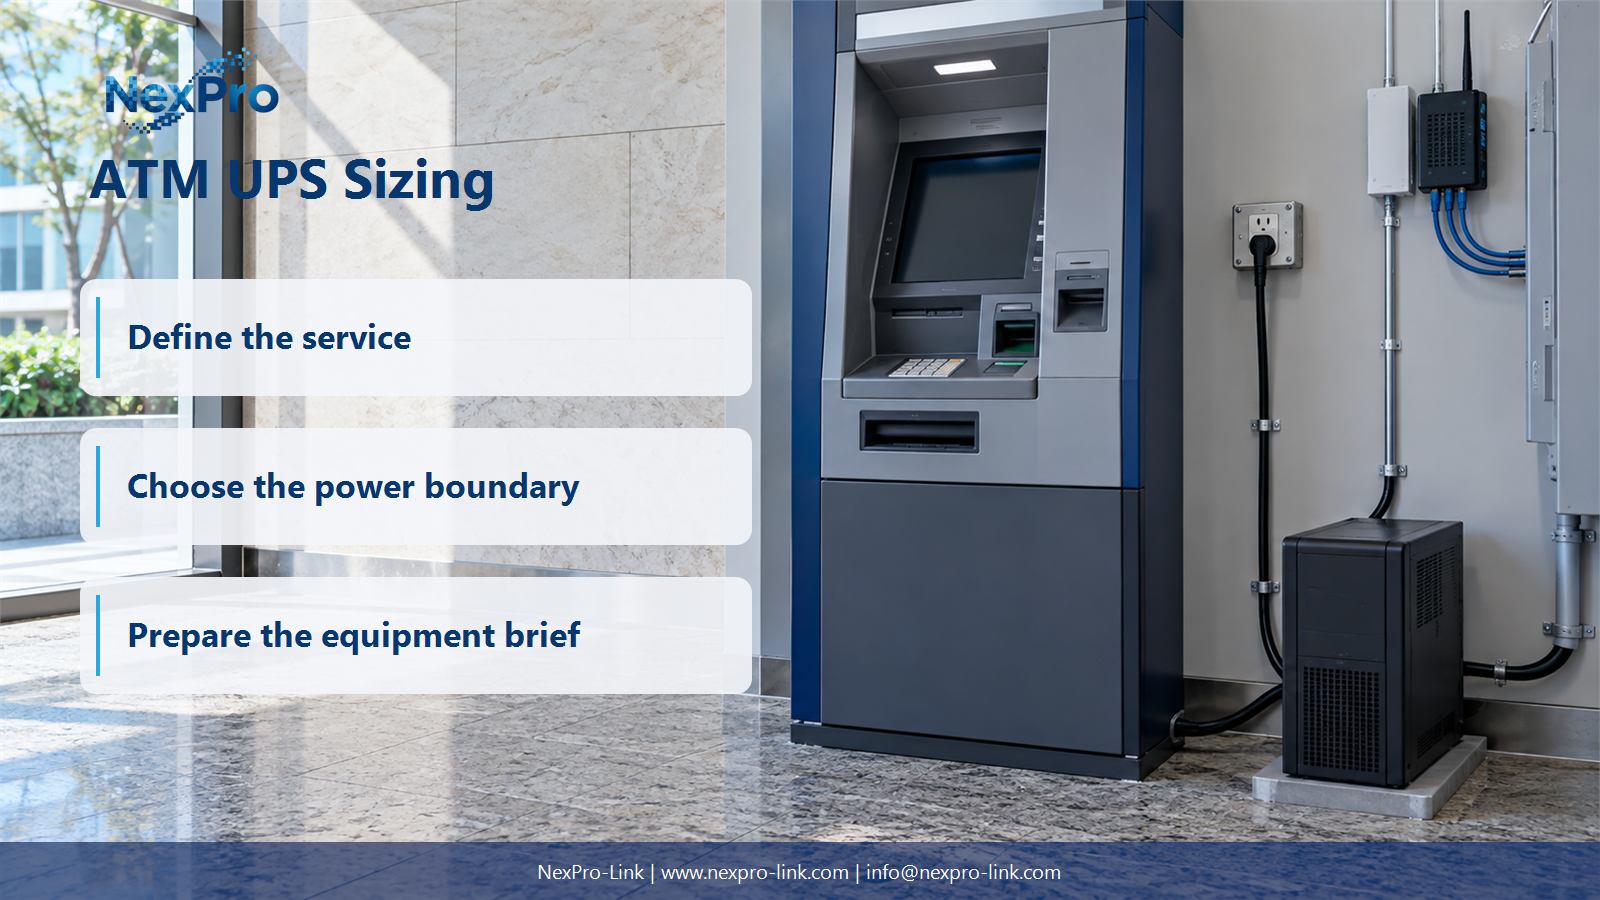
The first job is to fix the point where demand is measured. An "ATM" is rarely one device. It is a cabinet, a computing unit, a card reader, a receipt printer, sometimes a camera, a modem and a network switch. These parts draw power at different points. If the UPS protects only the computing unit, the boundary sits at that unit's AC input. If it protects the whole cabinet, the boundary sits at the cabinet feed.
Measure at the input of the complete equipment included in the backup scope, and name what sits outside it. Two mistakes are common. A component-level estimate adds the CPU board, the display, the reader and the printer, then forgets the internal power conversion and the cooling fan. A nameplate total does the reverse: it adds the maximum rating printed on every supply, a figure that usually runs far above operating draw.
An input sheet keeps the boundary visible and stops the two errors from leaking into the RFQ.
The numbers above are teaching inputs for this article, not measured values from a customer site.
| Decision area | Project question | Required output |
|---|---|---|
| Set the Measurement Boundary | Where should ATM demand be measured or recorded? | Input sheet: boundary / included devices / measured W / source |
| List the Working States | Which ATM operating states belong in the budget? | Profile table: idle / transaction / peripheral / recovery |
| Check W and VA Limits | How should W and VA be compared? | Capacity table: W / PF basis / VA / UPS W-VA |
Section 02
List the Working States
An ATM is not a steady load. It idles between customers, rises during a transaction, pulses the receipt printer and the cash dispenser, then settles again. A UPS sized for the idle reading will be too small. A UPS sized for a worst-case guess will be larger and more costly than the terminal needs.
List the states the actual configuration passes through, and record a demand for each. Standby covers the idle terminal. Active transaction covers the peak while the reader, the display and the dispenser run together. Peripheral activity, such as a receipt printer or a status modem, may already sit inside the transaction reading or may need a line of its own. Recovery covers the moment the terminal restarts or returns to idle. Use documented or measured demand for each state. Do not assume every terminal in a fleet peaks the same way, and do not treat a nominal rating as a description of every state.
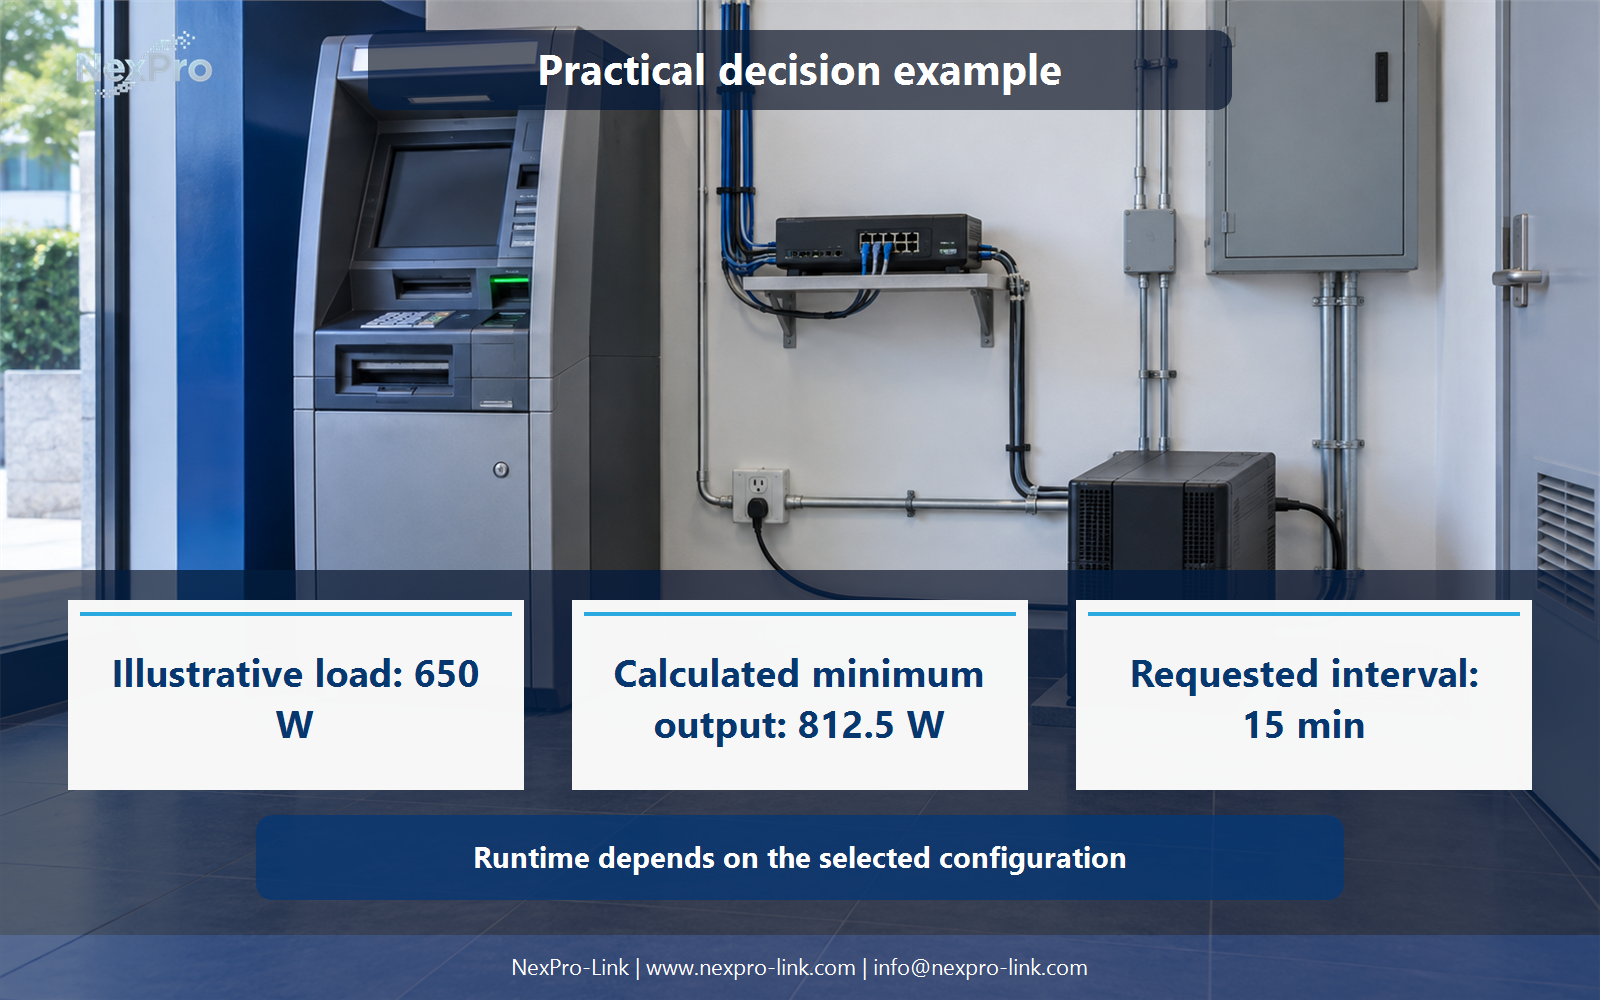
The 650 W peak is the number the next two sections work from. It matters more than any idle reading, because the UPS must carry the highest sustained state, not the average one.
Section 03
Check W and VA Limits
Watts and volt-amperes are not the same quantity. Watts measure the real power the load consumes. Volt-amperes measure the voltage-times-current product the UPS must be able to carry. When the load's current and voltage are not perfectly in phase, the VA figure runs higher than the watt figure. The ratio between them is the power factor.
A UPS has two output limits, one in watts and one in VA, and the load must sit under both. A headline such as "1 kVA" shows only half the story. If the same unit is rated 900 W and the load needs 812.5 W plus reserve, the watt side becomes the binding constraint, and the VA headline alone would not reveal that.
Estimate VA from watts only when you have a power factor to use, and label the assumption. The formula is VA equals W divided by PF. In the worked example below, the power factor is assumed at 0.90 as a teaching input.
A tower-style online unit such as the NexPro-Link NX-UP-HF-001 series, configuration SP1K, is published at 1,000 VA and 900 W. Both figures clear the minimums above, so the configuration works as a reading of how series, configuration and rating map onto a decision. This is an illustrative candidate. It is not a final selection. The site's 12 V / 7 Ah × 2 battery field is a configuration detail and does not state a tested runtime at this load.
- Confirm the answer to: How should W and VA be compared?
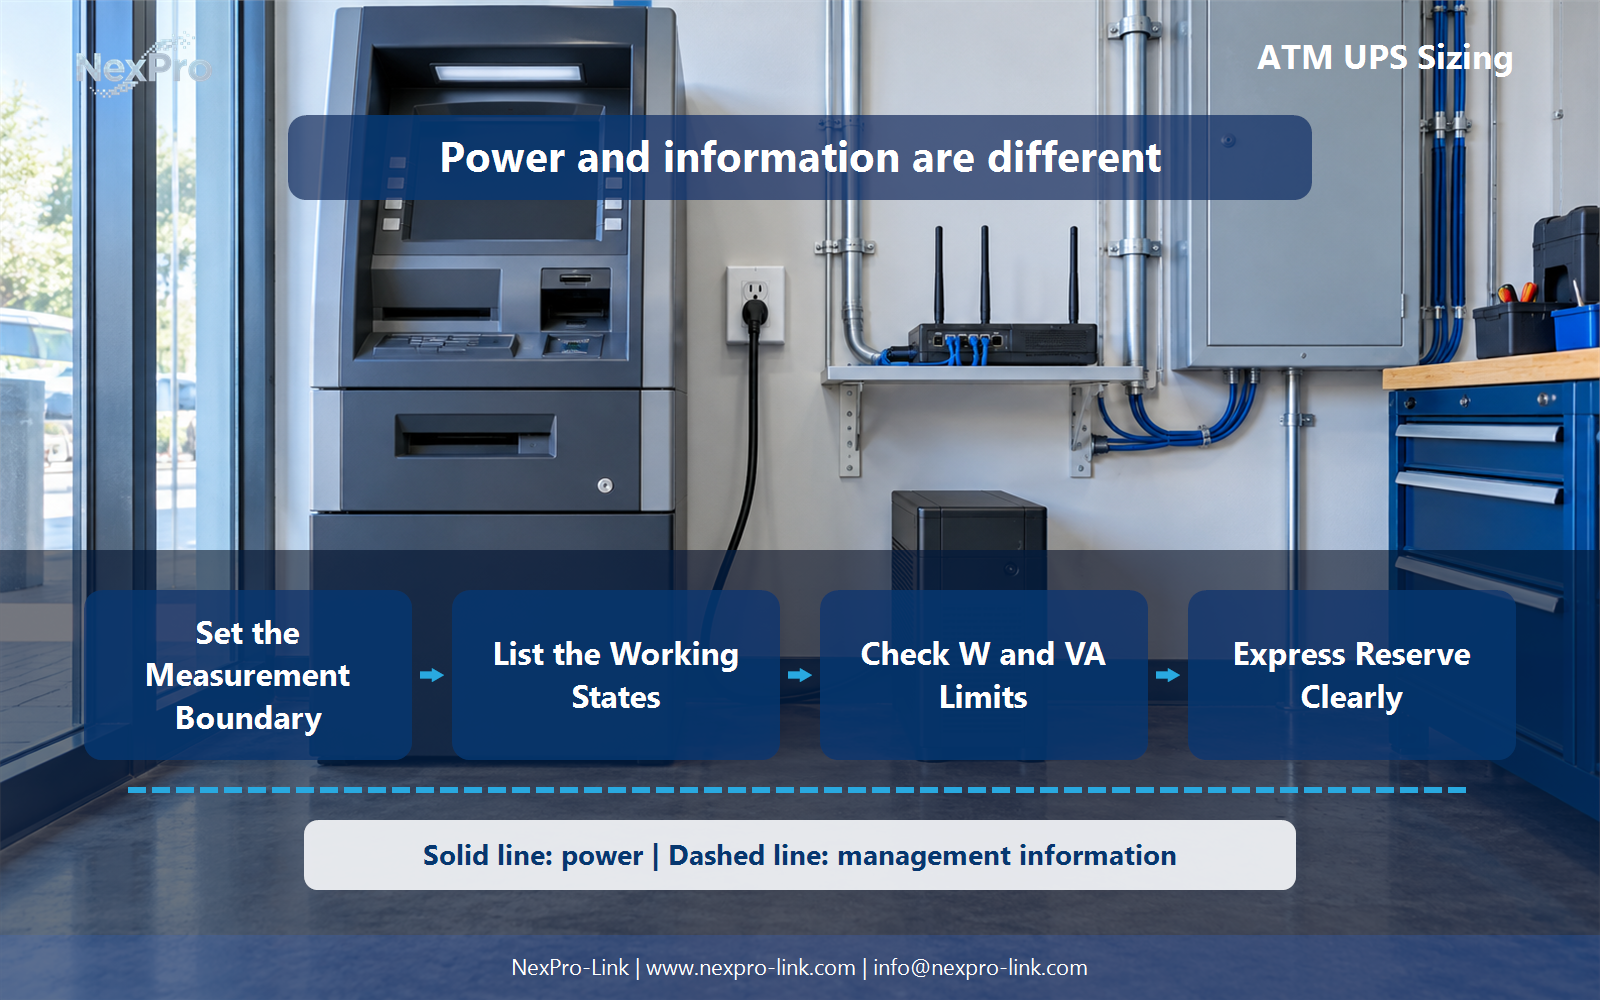
- Draw electrical power as a solid path and management information as a separate dashed path.
- Keep external services and specialist approvals outside the UPS equipment claim.
Section 04
Express Reserve Clearly
Reserve is where many RFQs go soft. "Add twenty percent" and "limit utilization to eighty percent" sound close and produce different numbers.
Adding twenty percent multiplies the demand. Limiting utilization to eighty percent divides it. On a 650 W load, adding twenty percent gives 780 W. Limiting to eighty percent gives 812.5 W. The second figure is more conservative and carries a different meaning: it reserves a share of the UPS output for aging, small future loads and measurement error. Stating the policy removes the guesswork for the supplier.
Keep planned equipment changes separate. If a second camera or a signage controller arrives next quarter, list it as a known future load and size for it in the open. If it hides inside a vague margin, the reserve meant for uncertainty gets spent on a change you already knew about.
Pick one policy and apply it to both W and VA. Mixing them, or using a percentage without saying whether it multiplies or divides, is how two teams reach two different ratings from the same load.
Section 05
Budget a Supported Stop
Runtime for an ATM is not a promise to keep dispensing cash. The UPS does not decide how a transaction ends; the terminal's application does. The battery interval has a narrower job: give the terminal enough time to finish or reverse the transaction in progress, notify the host if the link is still up, and stop without corrupting a journal or a card reader state.
Build the runtime from the workflow, not from a marketing number. If the terminal supports a controlled shutdown that takes three minutes, and you want two minutes for communications and operator decision, the objective lands around five minutes. A fifteen-minute request covers that with headroom, but the extra minutes remain an objective, not a measured battery capability. Over that window the load would draw 162.5 Wh (650 W × 15 min / 60), a load-side figure that does not yet account for conversion losses, discharge rate, temperature or battery aging.
The fifteen-minute objective belongs in the RFQ. A bare "how long will it run" question, without the workflow behind it, invites a runtime answer that has nothing to do with what the terminal needs to do in that time.
Section 06
Issue a Device-Level RFQ
At this point the sizing work folds into a short brief. Send the load profile, the W and VA basis, the interfaces, the fit constraints and the required interval. That is what NexPro-Link needs to discuss matching equipment. The capacity numbers are a selection input. They do not guarantee terminal integration, and they do not guarantee a fixed battery runtime.
The RFQ works best when it reads like the tables above: each figure tied to a boundary, a state or a policy. A supplier can then confirm or question the assumptions instead of guessing at them.
!Functional diagram connecting set the measurement boundary with check w and va limits, using separate power and information paths.
The power path and the information path stay separate in this brief. The power path runs from the selected source through the UPS or defined backup system and the approved distribution to the included load. The management path carries status and shutdown signals on its own. Keeping the two apart in a diagram and in the RFQ prevents a supplier from assuming a software integration that no one specified.
Engineering references
These sources support the general planning principles. Always use the selected product's current datasheet and applicable project standards for final design.