

Split a runtime trend into load, configuration and battery factors without treating an estimated runtime as a measured guarantee.
Section 01
Define a Comparable Baseline
Split a runtime trend into load, configuration and battery factors without treating an estimated runtime as a measured guarantee.
A runtime trend only means something when two readings describe the same thing. Record the battery configuration, the protected load and the operating conditions before you compare dates. An estimate captured without those inputs is hard to interpret later.
Three kinds of value can appear in a runtime conversation, and they are easy to mix up. A measured observation is a value the site recorded directly, such as the load at the UPS output. A displayed estimate is the number the unit calculates from its own model and the inputs it can see. A required service interval is the time the site must have available to finish a defined action, such as a clean shutdown. Keep the three apart in the record.
The configuration row is a real catalog entry. The load, room temperature and display figure are teaching values for the scenario. With those columns fixed, the site can ask a precise question later: did the load change, the configuration change, the conditions change, or all three?
| Decision area | Project question | Required output |
|---|---|---|
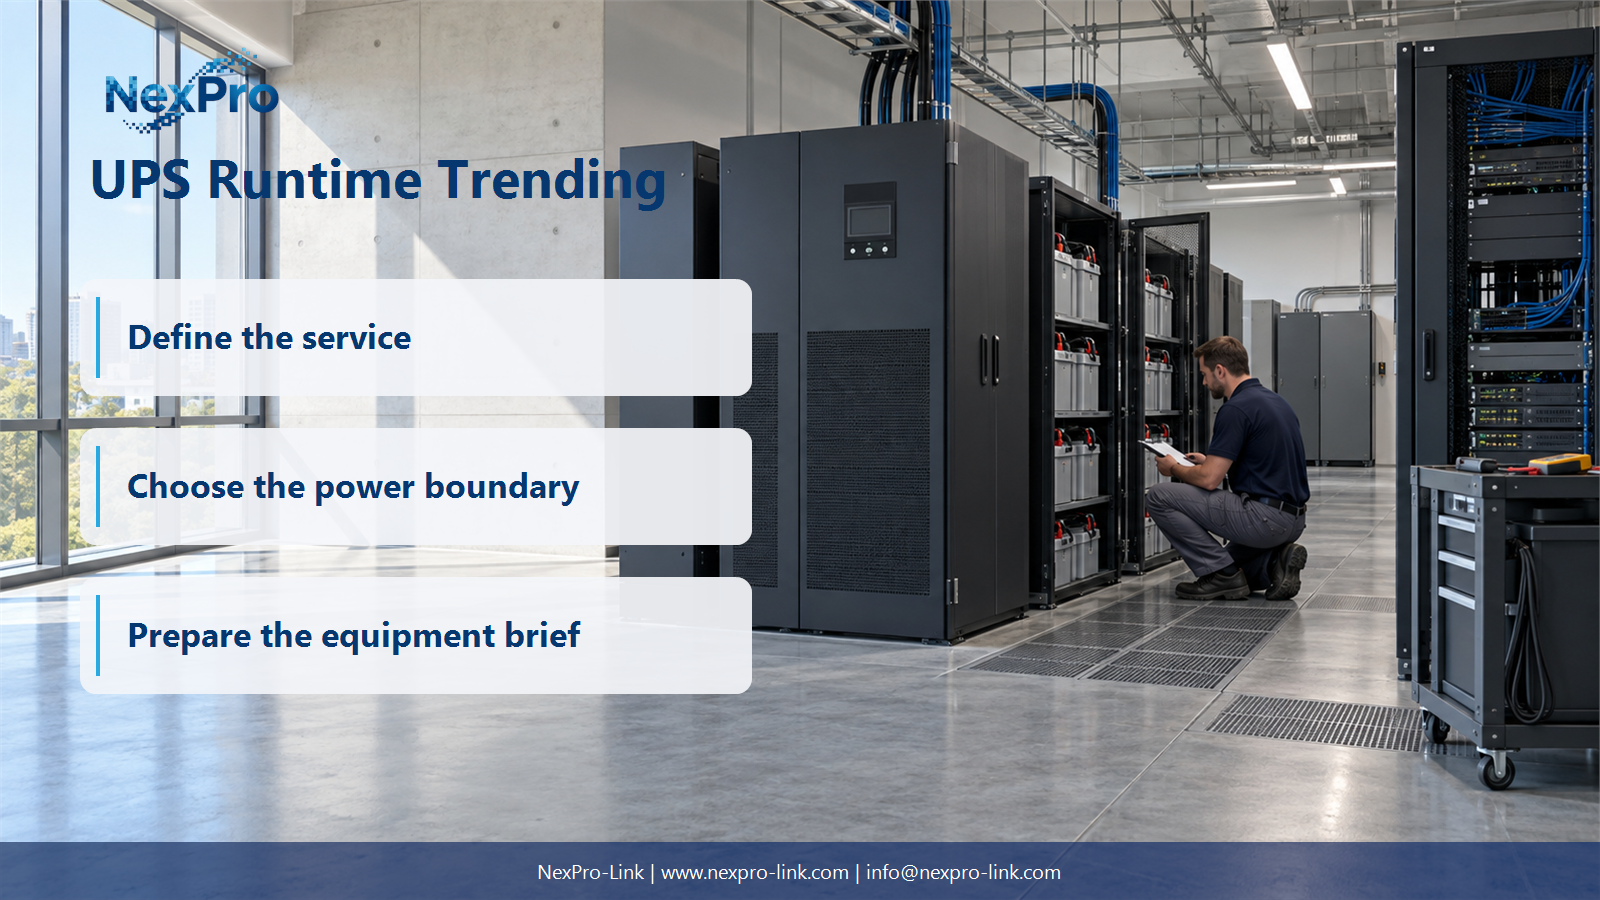
| Define a Comparable Baseline | What should a runtime baseline include? | Baseline table: configuration / load / conditions / estimate-observation |
| Separate Load Growth from Degradation | Does lower displayed runtime always mean a failing battery? | Change map: load / configuration / conditions / estimate / investigation |
| Track the Service Margin | What is the useful operational comparison? | Readiness table: required interval / observed basis / reserve / action |
Section 02
Separate Load Growth from Degradation
A lower displayed runtime does not prove a failing battery. Demand, configuration, temperature and the unit's estimation behavior all move the number. The first job is to compare consistent states and find which input changed.
In the scenario, the team adds one server and one switch. The load rises from 480 W to 600 W. The room temperature also climbs from 24 C to 28 C, and the display drops from 24 minutes to 14 minutes. All three shifts show up at once, so the drop cannot be read as a battery fault on its own.
For a fixed battery, a load increase from 480 W to 600 W would scale a simple estimate by roughly 480 divided by 600, about 0.80, which points to around 19 minutes rather than 24. The extra drop to 14 minutes suggests a second factor, likely the higher temperature or battery aging. That scaling is a rough check, not a runtime guarantee, and it does not replace the manufacturer's load-dependent curve.
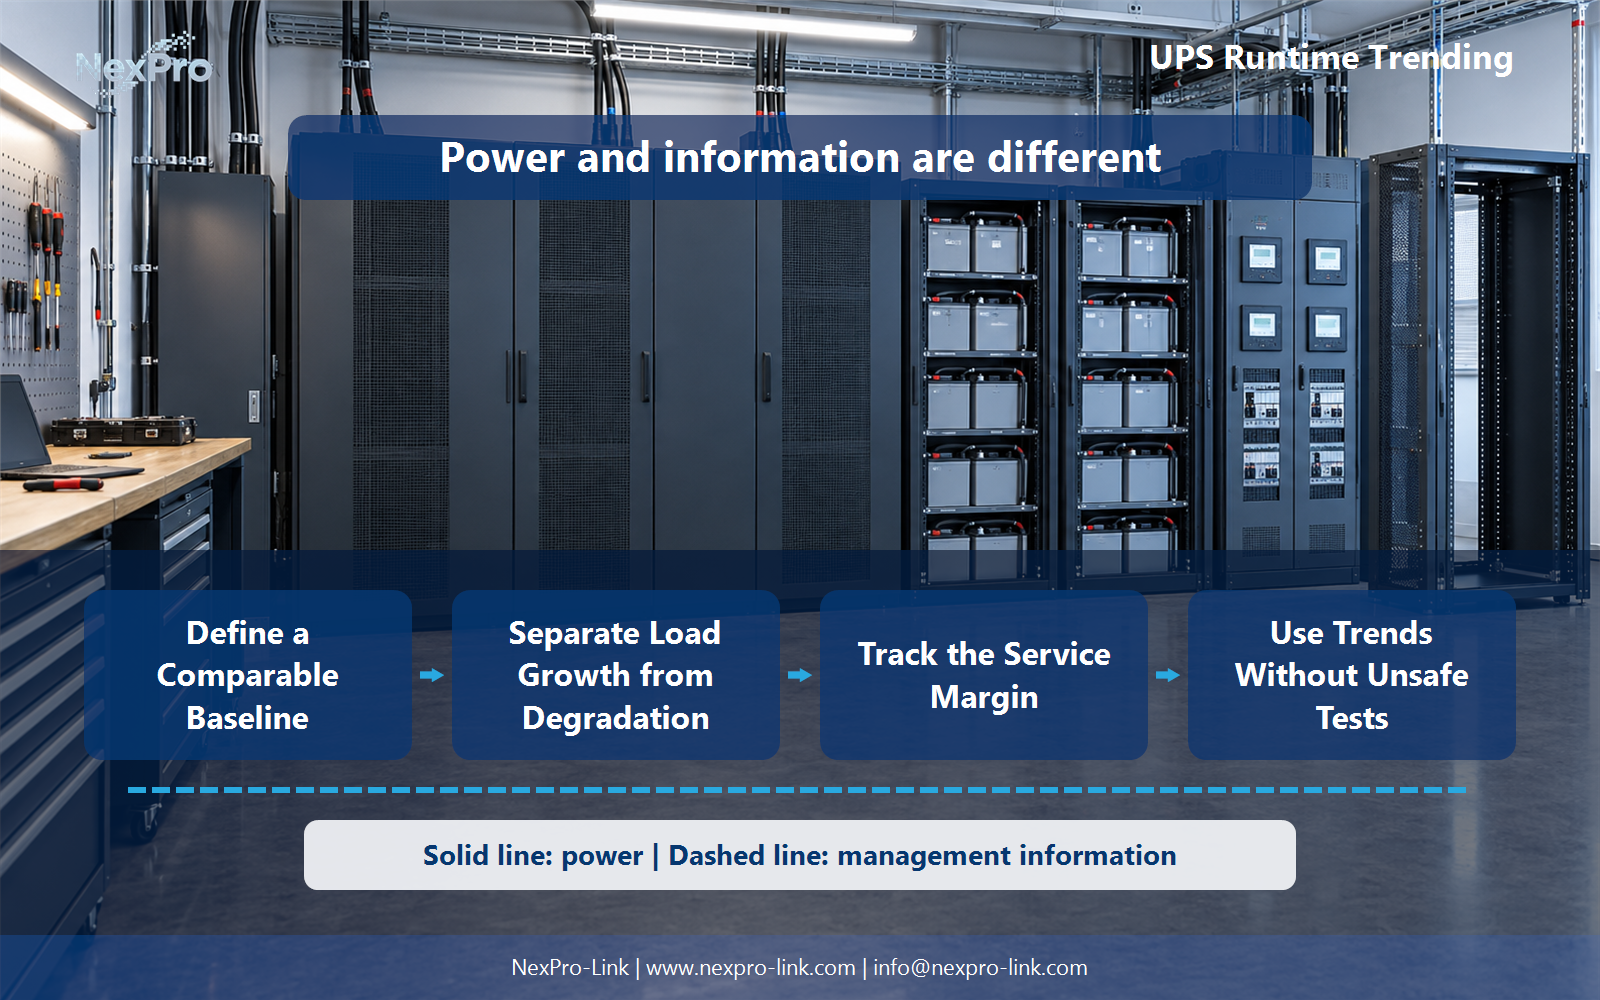
The change map records the comparison so the decision stays tied to evidence. Power delivery and management information are different lanes here. The load measurement describes the power path, while the displayed estimate is management information computed from that path.
Section 03
Track the Service Margin
The comparison that matters is the gap between the required supported action interval and the configuration's available information at the relevant load. State the basis of each value and where it is uncertain.
The required interval belongs to the service, not the equipment. If the site needs 15 minutes and the display shows 14, the readiness margin is negative. The team can still act, but it should know the number is an estimate at a stated load and temperature. A display figure alone does not certify what the battery can deliver under a different condition.
- Confirm the answer to: What is the useful operational comparison?
- Draw electrical power as a solid path and management information as a separate dashed path.
- Keep external services and specialist approvals outside the UPS equipment claim.
Section 04
Use Trends Without Unsafe Tests
A routine trend check does not need a full discharge. Status, load and configuration records support observation. Performance tests follow the equipment's supported and authorized procedure, in an approved window, and they are not a substitute for a weekly reading.
The observation plan keeps daily practice separate from an authorized test. A routine check watches the display, the logged load and any events. A deeper check stays inside the supported procedure. Running an unplanned discharge on the production load adds risk without adding a comparable reading.
Section 05
Connect Changes to Procurement
An equipment change becomes a decision when the defined service objective is no longer supported or the selected equipment guidance says to act. Keep battery service separate from a capacity upgrade or a changed architecture.
Buying a larger unit is not the automatic answer to a runtime concern. If the load explains the drop and the battery is healthy, the question is whether the current configuration still meets the objective. If the battery is aging, the first move is service and a re-measure. If both factors appear, handle the battery first and then decide whether capacity still needs to change.
Section 06
Prepare an Update Request
A supplier needs a specific set of inputs. "The runtime fell" is too vague to quote against. Send the current configuration, comparable load records and the required future interval. NexPro-Link can discuss suitable equipment and supply options against those numbers.
Keep trend observations separate from a guaranteed diagnosis. The brief describes what the team saw and what it needs. It does not promise that one replacement restores every system function.
Engineering references
These sources support the general planning principles. Always use the selected product's current datasheet and applicable project standards for final design.